
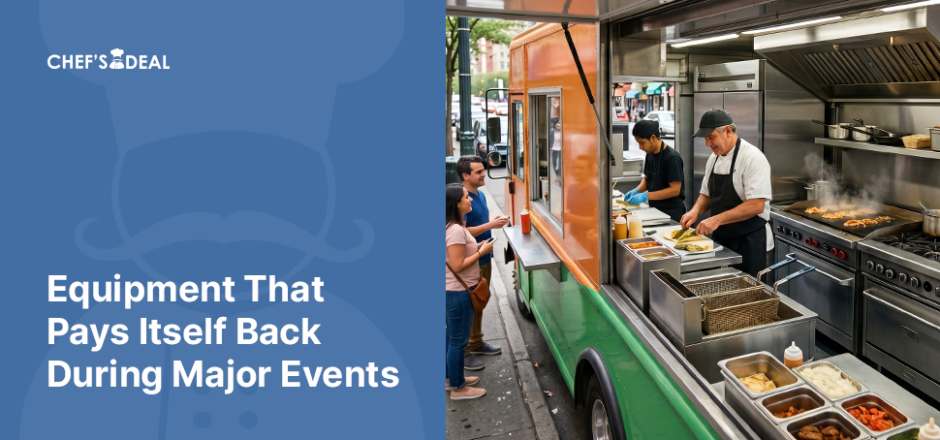
High-traffic events, such as the FIFA World Cup, the Super Bowl, and stadium concerts, compress weeks of normal revenue into a single service window. Commercial griddles, fryers, ice machines, refrigerated prep tables, food warmers, and merchandisers consistently recover their cost within days under event-level demand. The payback mechanics include purchasing the best equipment for your setup and menu items.
Quick ROI Snapshot: What Pays Back Fastest at Events
| Equipment Type | Typical Payback | Why It Pays Fast | Best Use Case |
| Flat Top Griddles | Same day | Promise high output, simple menu | Burgers, sandwiches |
| Commercial Fryers | Same day | Cook high-margin staples | Fries, chicken, snacks |
| Ice Machines | 2–6 days | Boost beverage sales | Beverages, combos |
| Prep Tables | 1–3 days | Enable faster assembly | Multi-item menus |
| Food Warmers | Same day | Prevent lost sales | Peak rush buffering |
| Beverage Coolers | 1–4 cycles | Maximize impulse purchases | High-traffic POS |
| Merchandisers | 1–3 days | Increase ticket size | Add-on sales |
What Does “Equipment That Pays Itself Back” Mean?
Equipment that pays itself back means foodservice appliances that generate enough gross profit within a defined period to cover the purchase price. The high-volume events promise investment returns in days or weeks, not the years typical of standard restaurant ROI calculations. The payback period depends on equipment cost, menu margin, and transaction volume.
Payback Period in Foodservice
Payback period in foodservice refers to the number of operating days required for equipment to recover its cost through the profit it generates. Operators often calculate this using a straightforward formula that accounts for the daily contribution of the menu items the equipment supports.
Payback Period = Equipment Cost / Daily Profit Contribution
A $2,000 commercial fryer generating $400 per day in profit from fried items can recover its cost in as little as 5 high-volume event days under peak conditions. That same unit not only pays for itself but also generates a 100% return on the initial investment during a 10-match event if demand remains consistent.
Why High-Traffic Events Change ROI Calculations?
High-traffic events affect ROI calculations because hourly transaction volume can reach 5 to 10 times the baseline daily volume. A high-recovery restaurant griddle producing 60 burgers per service hour can sustain 150 to 200 burgers per hour during a stadium match-day rush.
This surge in throughput multiplies gross profit per equipment unit, collapsing a 90-day standard payback into a 3 to 7-day event payback. Equipment ROI at major events is primarily a volume story, not a margin story.
Why Major Sports Events Create Unique ROI Opportunities?
Major sports events create unique ROI opportunities due to the concentrated demand spikes, elevated average ticket sizes, and faster turnovers they promise. The FIFA World Cup 2026, spanning 16 host cities across North America, represents the most significant near-term event opportunity for foodservice operators in a generation.
Short-Term Demand Spikes Around Stadiums & Fan Zones
Short-term demand spikes around stadiums and fan zones compress hundreds of customer transactions into 60 to 90-minute pre-kickoff and post-game windows. FIFA World Cup 2026 venues seat 65,000 to 94,000 spectators per match; fan zones add hundreds of thousands of additional attendees.
AT&T Stadium in Dallas and Hard Rock Stadium in Miami already experience measurable surges in street food sales on NFL game days. World Cup projections suggest a baseline shift that dwarfs the traffic of standard professional sports events. Operators in these traffic corridors see peak-hour throughput that makes equipment investment recovery almost certain, even on a single-event weekend.
Higher Ticket Sizes & Faster Turnover
Higher ticket sizes and faster turnover both surge during major sports events: unfamiliar menus, impulse purchases, and group dining behavior drive international event crowds. Visa’s 2022 World Cup data shows international fans spent 39% more per transaction than domestic attendees. Longer stays, longer travels, and ‘once-in-a-lifetime’ spending during World Cup 2026 can push that gap much higher.
Turnover accelerates because compressed match-day timelines force fans to buy and move: dwelling time at a vendor stall drops from 4 to 6 minutes under normal conditions to 90 seconds or less during pre-kickoff rushes. Equipment that sustains this pace of throughput generates more gross profit per operating hour than in any other foodservice context.
Case Context: FIFA World Cup 2026
The FIFA World Cup 2026 context spans 16 host cities, including New York/New Jersey, Los Angeles, Dallas, Miami, Atlanta, and Seattle, with 78 matches scheduled in 11 US cities across June and July 2026. MetLife Stadium hosts the final, creating a concentrated high-demand environment across the New York/New Jersey metro area.
Temporary vendors and scaling restaurants can benefit from the extended tournament schedule. Temporary operators recover equipment costs over multiple match days; established restaurants and sports bars can deploy additional equipment that pays itself back within the first few match days. Dallas and Atlanta host semifinals, generating multi-day demand peaks that extend well beyond individual match windows.
Many temporary vendors and first-time operators entering the market during major tournaments prioritize fast setup and lower upfront costs. Businesses planning temporary food operations can review this detailed guide on ‘Street Food Business Setup for World Cup 2026‘.
Top Equipment That Pays for Itself Fast During Major Events
The equipment that pays itself back the fastest includes:
- Top Griddles
- Commercial Fryers
- Ice Machines
- Refrigerated Prep Tables
- Food Warmers & Holding Equipment
- Beverage Coolers
- Merchandisers
These appliances share 3 traits: high transaction contribution, low idle time, and direct linkage to top-selling menu items.
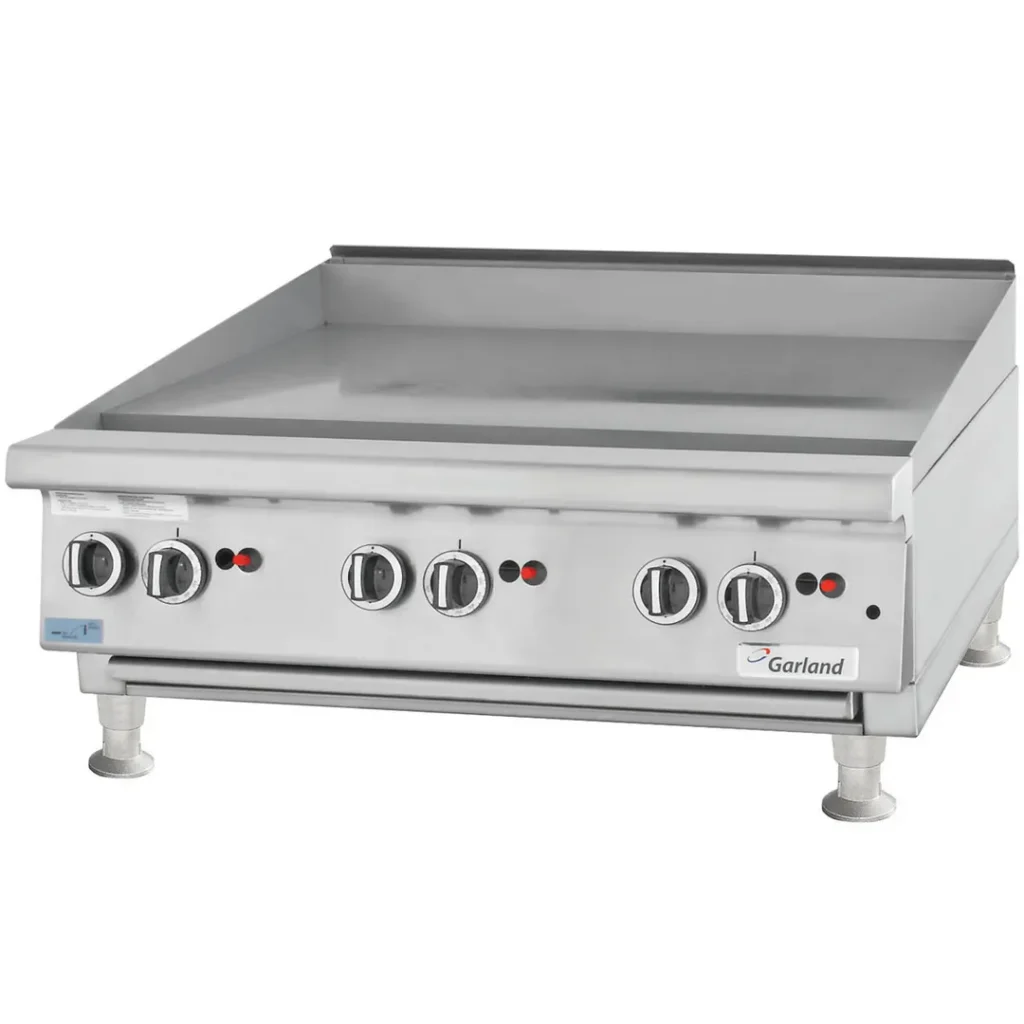
Flat Top Griddles
Flat top griddles are among the highest-throughput cooking surfaces available to event operators. A quick math reveals how fast they start making money.
- Capacity: A 36-in (91.44 cm) commercial griddle comfortably holds 8 to 12 burger patties, depending on spacing and patty size.
- Throughput: A multi-person team produces approximately 120-160 smash burgers per hour with a 2-minute cook time.
- Revenue Potential: This translates to $546 to $936 in gross profit per service hour at an average selling price of $7 to $9 and a 65% gross margin.
- Payback Window: A $1,500 to $3,000 commercial flat-top griddle recoups its cost in 3 to 4 service hours under event conditions.
Strategic Advantage: These units maximize revenue per square foot on constrained vendor setups by also cooking buns, quesadillas, and egg-based items without swap time.
Commercial Fryers
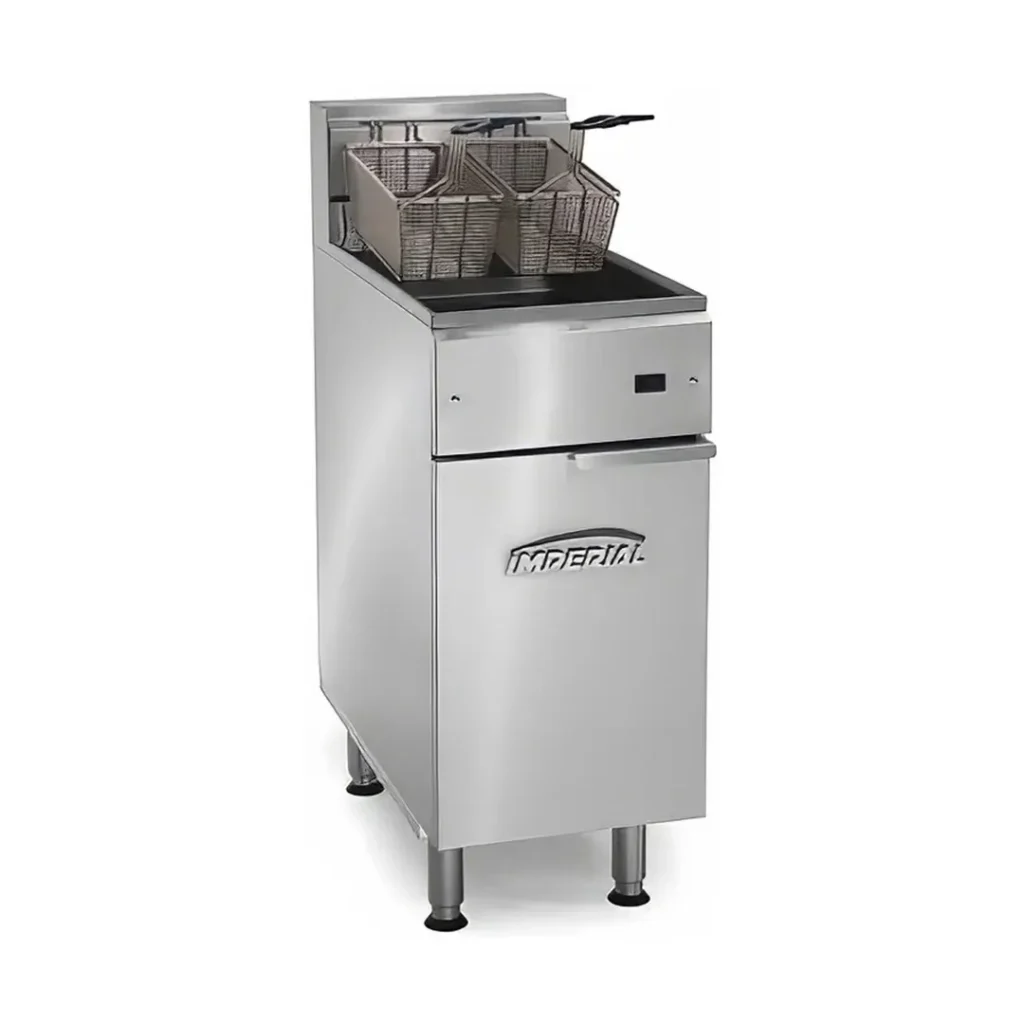
Commercial fryers deliver some of the highest-margin offerings in foodservice. French fries, fried chicken bites, and snack-size items carry low food costs and cook in 3 to 4 minutes per batch.
- Capacity: A 40-lb (18.144 kg) commercial fryer continuously cooks batches of about 10 lb (4.536 kg) to 15 lb (6.804 kg).
- Throughput: It supports 120-180 individual fry portions per hour.
- Revenue Potential: That equals $360 to $540 in gross profit per hour at a $4 selling price and 75% gross margin.
- Payback Window: Entry-level commercial fryers, priced from $600 to $2,000, pay back in 1.5 to 6 service hours.
Strategic Advantage: Dual-basket fryers maintain oil temperature between batches, preventing throughput bottlenecks during peak rushes.
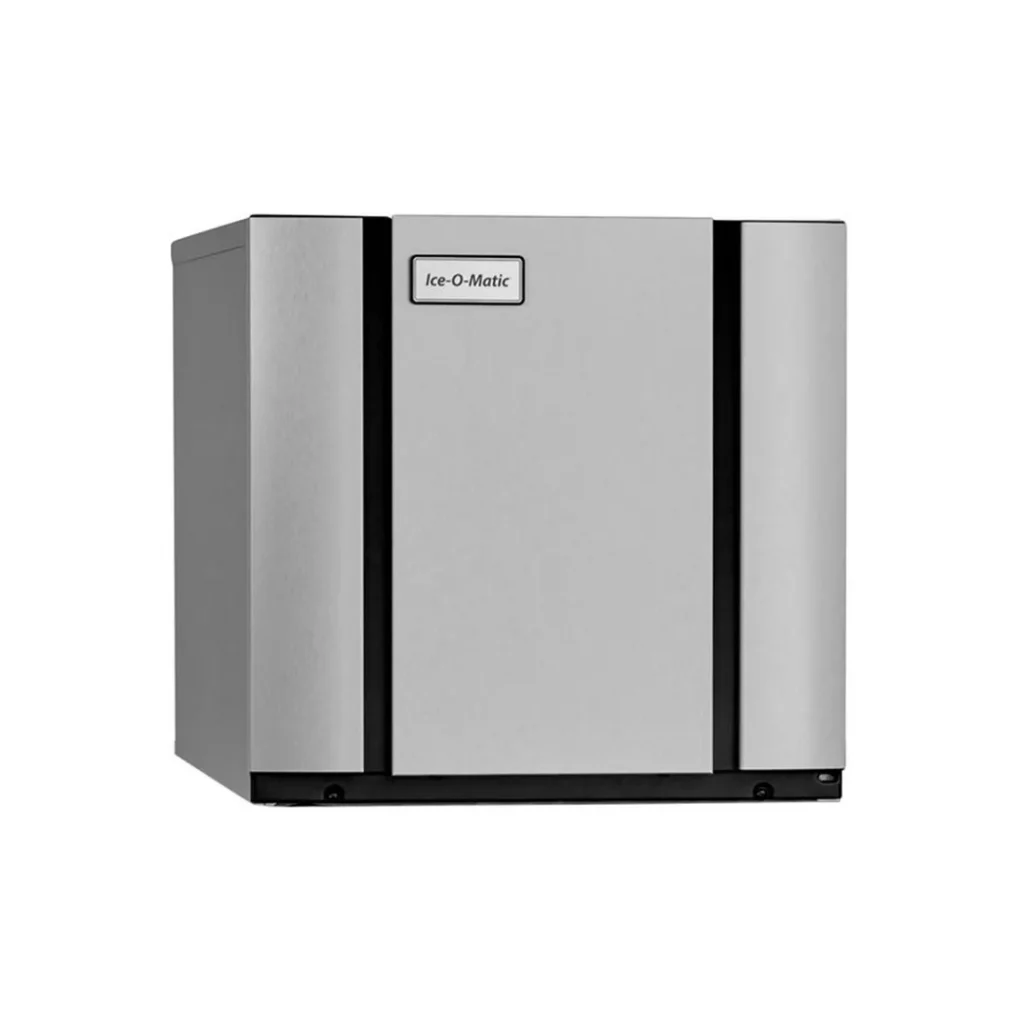
Commercial Ice Machines
Commercial ice machines drive beverage sales, the highest-margin category in event foodservice. They enable continuous beverage service, driving both standalone sales and combo upgrades.
- Capacity: A single modular ice machine can produce 300 lb (136.077 kg) to 500 lb (226.796 kg) of ice per day.
- Throughput: It supports around 400-700 beverages in 16-oz (473.176 mL) cups.
- Revenue Potential: That output generates $1,020 to $1,785 in gross profit daily at $3 per beverage and 85% gross margin.
- Payback Window: Mid-range modular ice machines that cost $3,000 to $6,000 return on investment in 2 to 6 days at event volumes.
Strategic Advantage: Nugget ice drives higher QSR customer satisfaction scores, directly increasing repeat purchases within the same event session.
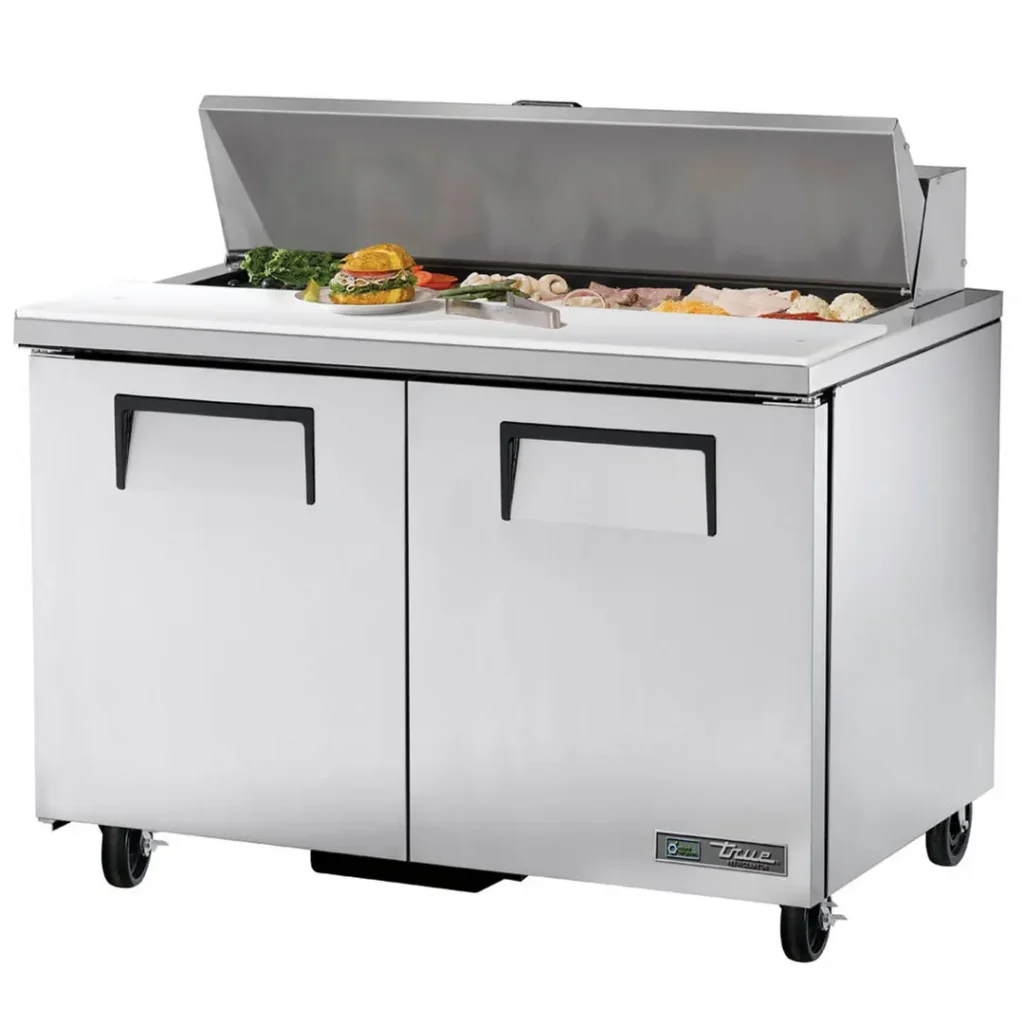
Refrigerated Prep Tables
Refrigerated prep tables reduce ingredient handling time compared to separate cold storage by placing refrigerated ingredient pans directly at the assembly point.
- Capacity: A 48 in (121.92 cm) prep table holds 12 to 16 ingredient pans at 33°F to 41°F (0.556°C to 5°C), keeping proteins, toppings, and sauces within arm’s reach during peak assembly.
- Throughput: Faster prep increases transactions per hour; every 10-second reduction in assembly time translates to 6 additional transactions per service hour.
- Revenue Potential: This amounts to $27.30 in additional gross profit per hour, based on an average ticket value of $7 and a 65% gross margin.
- Payback Window: Prep tables ranging from $1,200 to $3,500 pay back in 1 to 3 days at high-volume events.
Strategic Advantage: Front-breathing prep tables outperform standard models that require rear clearance for airflow, maximizing space efficiency.
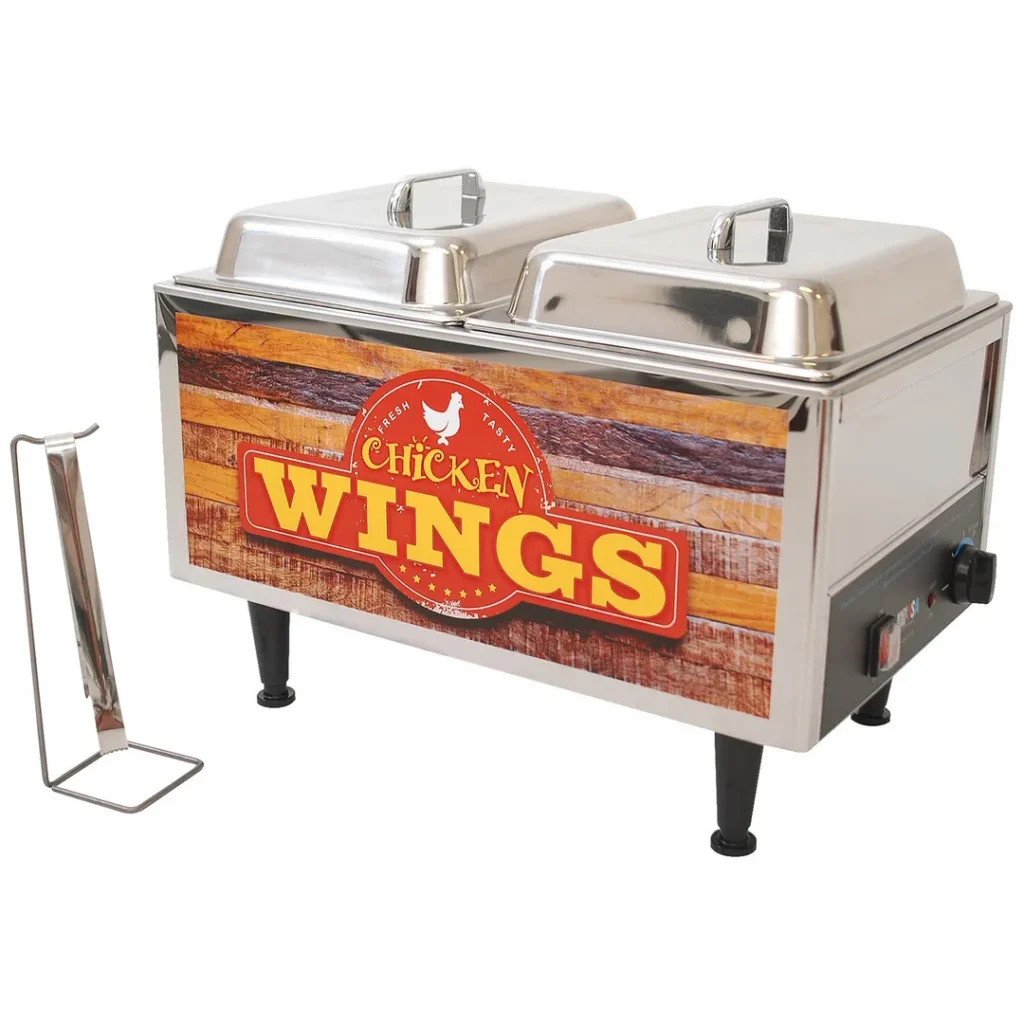
Food Warmers & Holding Cabinets
Food warmers and holding cabinets eliminate the bottleneck between cooking and service by staging batch-cooked items at safe holding temperatures.
- Capacity: Operators using food warmers can pre-cook 30 to 50 portions ahead of match-day demand spikes.
- Throughput: Serving from pre-staged inventory rather than cooking to order increases serving speed to 20-30 customers per minute.
- Revenue Potential: This prevents queue abandonment, capturing additional revenue in gross profit.
- Payback Window: A $300 to $1,200 countertop food warmer recovers its cost within the first 2 to 3 service hours of a major event.
Strategic Advantage: High-end warmers with precision humidity control prevent food from drying out or becoming soggy, keeping its just-cooked quality and appeal.
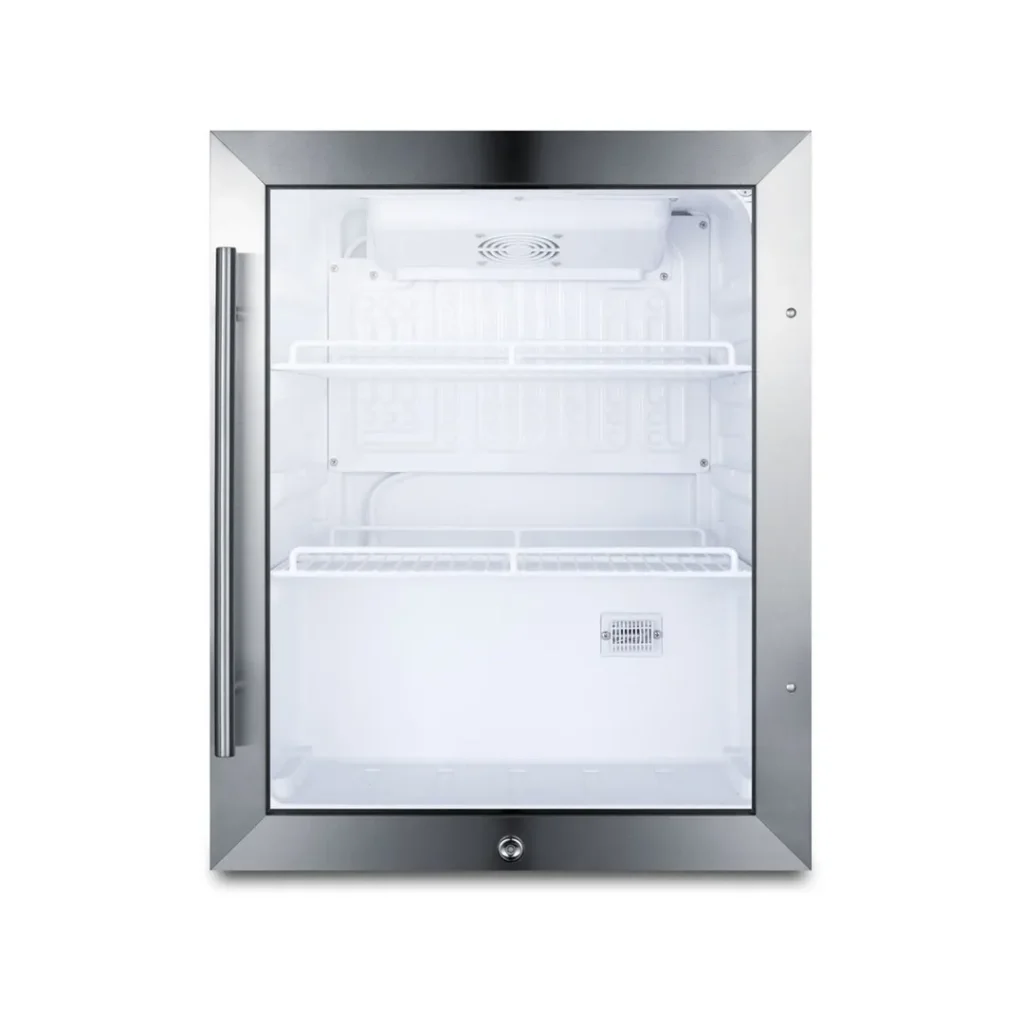
Beverage Coolers
Beverage coolers support impulse sales, the highest-conversion purchase category at events. Fans who see visible, chilled beverages at the point of sale convert at rates around 35% to 50% higher than when verbal upselling alone.
- Capacity: A 24 cu ft (679.603 L) reach-in beverage cooler accommodates roughly 180 to 220 bottles, depending on shelf configuration.
- Throughput: High-visibility glass doors enable rapid grab-and-go selection; a single cooler can support hundreds of transactions per hour during peak heat.
- Revenue Potential: This capacity generates $864 in gross revenue at $3 per unit and an 85% margin, resulting in $734 in gross profit per full turnover.
- Payback Window: Commercial beverage coolers ranging from $800 to $2,500 return on investment within 1 to 4 restocking cycles during a major event.
Strategic Advantage: Triple-pane glass coating in select models reflects heat and prevents condensation, keeping beverages visually appealing to customers even in high-humidity fan zones.
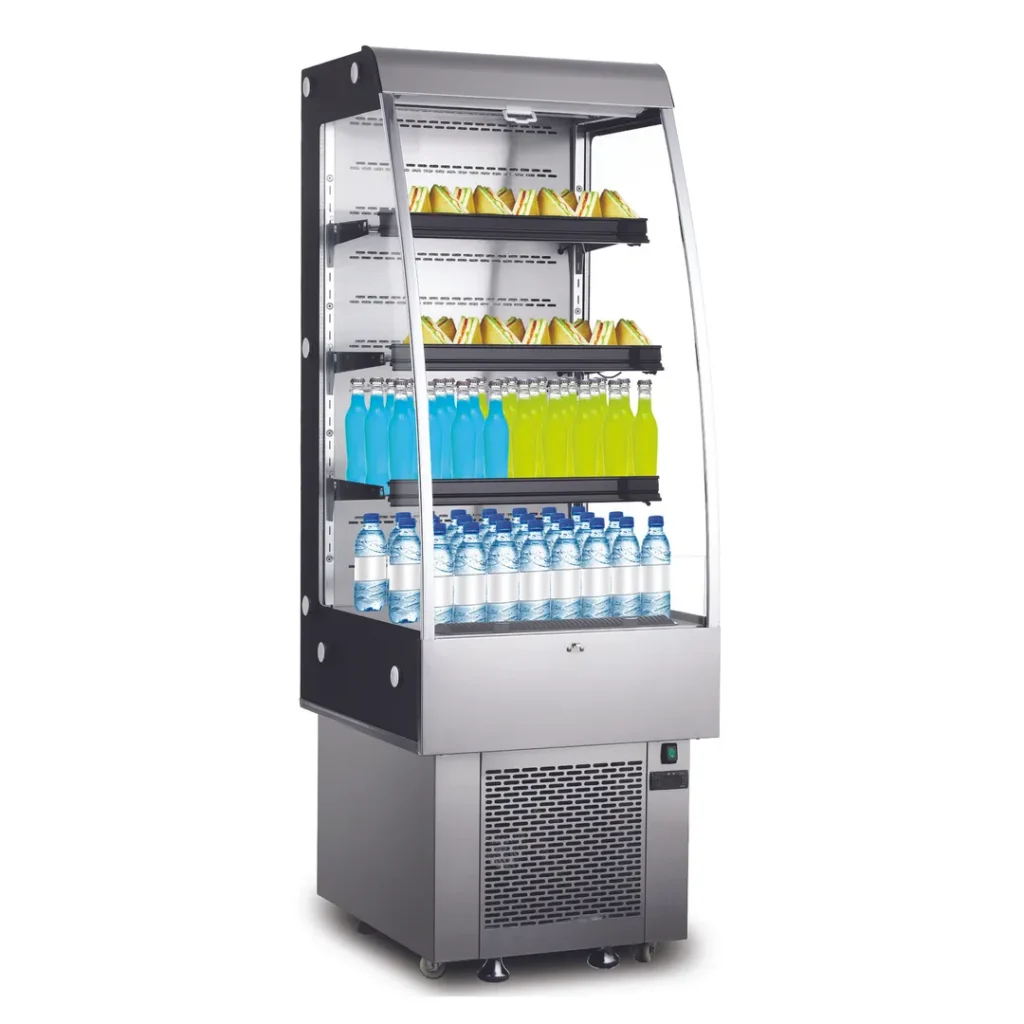
Merchandisers
Merchandisers drive impulse revenue by placing high-margin, ready-to-eat items in direct view of customers at point-of-sale positions. They transform empty counter or floor space into active profit centers by encouraging last-second additions to every order.
- Capacity: Merchandisers display snacks, packaged foods, and combo items across multiple tiers and sections, ranging from 1 cu. ft. to 86+ cu. ft.
- Throughput: These units increase average transaction size by $1.50 to $3.00 per customer without increasing service time or labor requirements.
- Revenue Potential: That uplift generates $450 to $900 in additional daily gross profit at 300 transactions per match day.
- Payback Window: Entry-level merchandising refrigeration, starting at $700 to $2,000, promises a 1- to 3-day payback at event volumes.
Strategic Advantage: Models with high-impact LED internal lighting draw the eye more effectively than standard lighting, maximizing add-on sales.
How to Estimate Payback: Simple ROI Examples
Payback estimation starts with 3 inputs: equipment cost, gross profit per unit sold, and realistic daily transaction volume. The examples below use achievable throughput figures based on a 3-person team operating during a 4-hour high-demand event window. Actual results vary by location, menu, and pricing.
- Example: Fryer + Fries (4-Hour Event Scenario)
Based on a high-traffic event window with continuous demand at premium pricing per order.
| Metric | Value |
| Equipment cost | $1,800 (40 lb / 18.144 kg countertop fryer) |
| Fries selling price | $4.50 per order |
| Food cost per order | $0.90 (20%) |
| Gross profit per order | $3.60 (80%) |
| Hourly output (4 hours) | Up to 90 orders/hr = 360 orders total |
| Total gross profit | 360 × $3.60 = $1,296 |
| Estimated Payback | ~1–2 service sessions (~6 hours total) |
Takeaway: High-margin, high-volume items like fries can recover equipment costs within one to two strong service periods.
- Example: Ice Machine + Beverage Sales (Event-Day Scenario)
Based on steady beverage demand throughout a full event day.
| Metric | Value |
| Equipment cost | $4,500 (400 lb / 181.437 kg modular ice machine) |
| Beverage selling price | $3.50 per cup |
| Food cost per beverage | $0.45 (13%) |
| Gross profit per beverage | $3.05 (87%) |
| Daily beverage output | ~500 cups |
| Total gross profit per day | 500 × $3.05 = $1,525 |
| Estimated Payback | ~3 event days |
Takeaway: Beverage programs, supported by reliable ice production, generate consistent high-margin returns across multi-day events.
- Example: Griddle + High-Volume Menu Items (4-Hour Peak Service)
Based on a streamlined menu and optimized multi-operator workflow.
| Metric | Value |
| Equipment cost | $2,400 (36 in / 91.44 cm commercial flat top griddle) |
| Smash burger selling price | $8.00 |
| Food cost per burger | $2.40 (30%) |
| Gross profit per burger | $5.60 (70%) |
| Hourly output (4 hours) | ~120–160 burgers/hr = up to 640 total |
| Total gross profit | Up to 640 × $5.60 = $3,584 |
| Estimated Payback | Within 1 service session (under peak conditions) |
Takeaway: High-throughput equipment paired with simple, fast-selling menu items can recover costs extremely quickly during peak event demand.
How to Choose the Right Equipment for Fast ROI
Choosing the right equipment for fast ROI during major events depends on aligning equipment capability with real event demand. Focus on menu-to-equipment fit, throughput-driven performance, and the physical limits of your setup to shorten payback time.
Match Equipment to High-Demand Menu Items
Select equipment based on the 3 to 5 menu items that generate the most transactions per hour. High-ROI setups connect each piece of equipment directly to a proven, high-demand product.
- Link each unit to a core seller: Pair flat top griddles with burgers, fryers with fries and wings, and ice machines with beverages.
- Prioritize fast-cooking items: Choose menu items that cook in under 3 minutes to sustain peak throughput.
- Target strong unit economics: Focus on items that sell above $5 with margins above 65%.
- Eliminate unsupported equipment: Avoid adding equipment that does not directly serve a high-volume menu item.
- Build a focused system: Limit the menu to a small set of high-performing items to maximize output and consistency.
Prioritize Speed & Throughput Over Variety
Design your equipment setup around transaction speed, not menu breadth. Revenue depends on how many orders you can complete per hour at major events.
- Maximize output per hour: Choose equipment that produces the most orders during peak windows.
- Avoid low-throughput versatility: Skip multi-function equipment that slows production across multiple items.
- Select commercial-duty equipment: Use units designed for continuous operation under heavy load.
- Maintain consistent performance: Ensure equipment maintains temperature and cycle times during 4–6-hour peak periods.
- Plan for real conditions: Account for high ambient temperatures common at summer events in cities like Dallas, Miami, and Houston.
Consider Space & Power Constraints (Food Trucks vs Kitchens)
Size your equipment to match the physical and electrical limits of your setup. Power and space constraints directly determine what can operate reliably during peak service.
- Match equipment to available power: Stay within your setup’s electrical capacity to prevent overloads.
- Leverage full kitchen capacity: Use higher-capacity systems in fixed kitchens to support expanded equipment setups.
- Optimize food truck configurations: Utilize 30–50 amp systems efficiently with a griddle, fryer, and refrigeration.
- Plan generator-supported setups: Use 5,000–10,000 W generators for stalls without grid access.
- Avoid overloading systems: Prevent mid-service shutdowns by sizing equipment below maximum power limits.
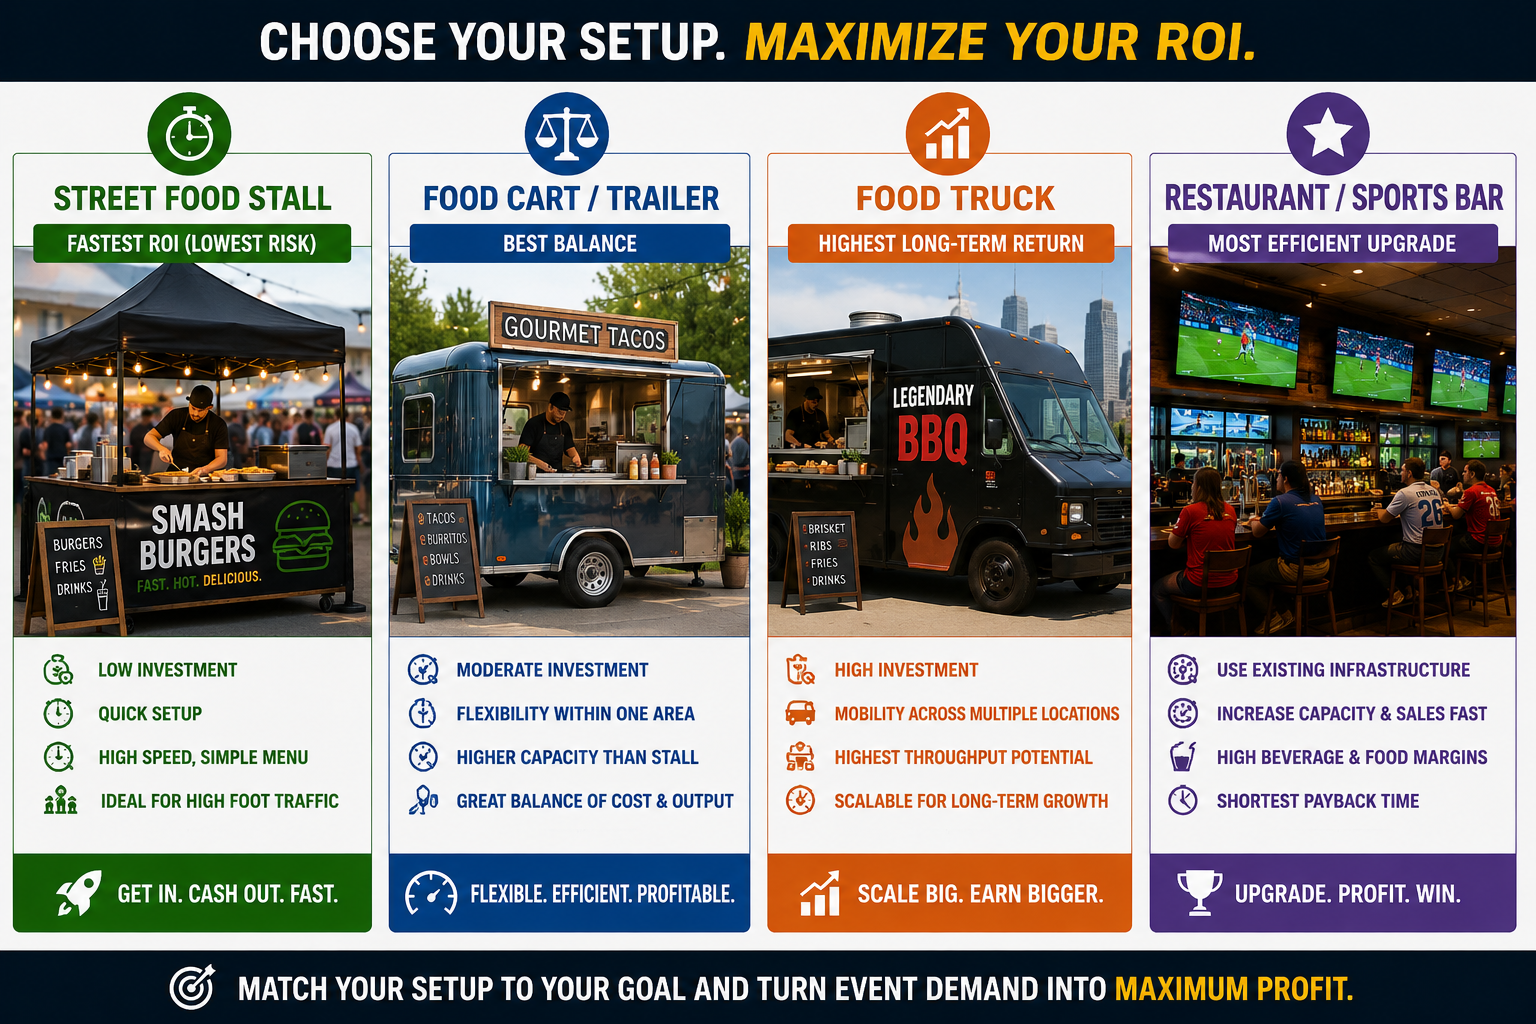
Street Food Stalls vs Trails vs Food Trucks vs Restaurants: ROI Differences
ROI differences between setup types reflect trade-offs between upfront investment, production capacity, and daily revenue potential. Each follows a different payback pattern, depending on how efficiently it converts event demand into transactions.
Quick ROI Comparison
| Setup Type | Revenue Potential / Day | Payback Profile | Key Payback Drivers |
| Street Food Stall | Moderate | Fast | Low setup complexity, focused menu, quick deployment |
| Food Cart / Trailer | Moderate–High | Moderate | Existing infrastructure, extended service hours, and high beverage sales |
| Food Truck | High | Moderate | High throughput, full kitchen integration, multi-location capability |
| Restaurant / Sports Bar | Very High | Instant (incremental) | Existing infrastructure, extended service hours, high beverage sales |
Street Food Stalls
Street food stalls offer the fastest path to payback because they combine minimal setup requirements with focused, high-speed operations. Their strength lies in simplicity: limited menus, fast deployment, and low overhead allow operators to convert steady foot traffic into consistent transactions during peak event windows. The main limitation is capacity: single-point setups cannot scale beyond a certain transaction volume.
Food Carts / Trailers
Food carts and trailers sit between stalls and trucks in both capacity and flexibility. They support a slightly broader menu and higher output while remaining easier to position within dense event zones. Their semi-mobile structure allows operators to adapt to foot traffic patterns without the complexity of a full vehicle setup, resulting in balanced and predictable payback timelines.
Food Trucks
Food trucks deliver the highest revenue potential among mobile formats due to their fully integrated kitchen systems and ability to sustain high transaction volumes. They support larger teams, more complex menus, and longer service hours. Initial investment is higher, but their capacity to operate across multiple locations and events strengthens long-term ROI.
Restaurants & Sports Bars
Restaurants and sports bars benefit from existing infrastructure, making investments in additional equipment highly efficient during major events. Operators can scale output quickly to handle demand spikes, with kitchens, utilities, and seating already in place. Extended service hours and strong beverage sales further accelerate payback, especially in venues located near stadiums or high-traffic fan zones.
Quick Decision Guide: Stall vs Trailer vs Truck vs Restaurant
Existing Business
Do you already operate a restaurant or sports bar near a stadium or fan zone?
Mobility Needs
Do you plan to operate across multiple cities or follow the tournament schedule?
Investment Level
Is your priority fast setup with minimal investment and low operational complexity?
Capacity vs Flexibility
Do you need moderate capacity with some flexibility, without committing to a full truck?
Long-Term Scaling
Do you want maximum throughput and long-term scalability beyond the event?
Which Event Foodservice Setup Type Delivers the Best ROI
FAQs About Commercial Kitchen Equipment That Pays Itself Back During Major Events
What equipment increases profit the most?
Ice machines increase profit the most because beverages carry the strongest margins in foodservice. Griddles and fryers also contribute significantly by driving high transaction volume, while merchandisers increase profit through impulse sales without adding labor.
Which equipment has the fastest payback period?
Flat-top griddles and commercial fryers deliver the fastest payback during major events within a single service session under peak conditions. They produce high-margin menu items such as burgers, fries, and fried snacks.
How long does it take to recover equipment costs?
It takes around 1 to 7 event days to recover equipment cost at major events, depending on price, output, and menu fit. Lower-cost items like fryers and griddles recover fastest, while higher-cost equipment like ice machines may take several days but generate consistent long-term returns.
Is it better to rent or buy equipment for events?
Buying equipment is usually more cost-effective if you plan to operate at multiple events. Rental costs can quickly add up over several days, while purchased equipment continues generating revenue and retains value for future use. Renting makes sense for one-time or short-term deployments.
Final Thoughts: Turning Event Demand into Immediate Profit
Major events compress equipment payback timelines from months into days. Griddles, fryers, ice machines, and similar high-output units generate consistent hourly profits that exceed their cost within short event windows. The FIFA World Cup 2026, spanning 16 host cities, represents one of the largest revenue opportunities for operators who know how to turn it into fast equipment ROI.
- Match equipment to the 3 to 5 menu items generating the highest gross profit per hour
- Choose commercial-grade, continuous-duty equipment rated for high-temperature event conditions.
- Size equipment to your power limits: generator capacity for stalls, electrical service for trucks and restaurants.
- Prioritize griddles and fryers for fastest payback; use ice machines to maximize daily profit through beverage sales.
- Scale your existing infrastructure to achieve the fastest ROI if you already own a restaurant or a sports bar near event venues.
Equipment ordered now qualifies for pre-tournament delivery and installation. Chef’s Deal stocks commercial griddles, fryers, ice machines, refrigerated prep tables, food warmers, and merchandising refrigeration from leading brands, with competitive pricing, free shipping, and financing options up to 84 months. Equip your operation now and recover your investment before the final whistle.

